 |
| Note that population density axis is on a logarithmic scale |
Population density is in population per-square-mile.
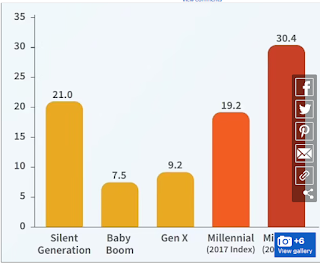
This article laments the declining life expectancy of women born between 1981-and-1999. It blames lack of access to abortions and rising suicide rates.
I find the numbers batted around in the article to be suspect. They claim that the maternal death-rate for women born between 1981 and 1999 to be 19.2 per 100k in 2017 while the CDC claims the death-rate due to pregnancies for women in that age cohort is 2.3 per 100k. It is very difficult to reconcile those numbers.
Looking more closely at the header of the chart, it says "per 100k births" but suggests 12% of the woman in that cohort gave birth in that year. That seems high.
It is also disingenuous to blend apples-and-oranges, i.e. all Millennials and then show death-rates for a small subset of them. The unsophisticated reader will think that they will be exposed to that rate every year and not just the years they are pregnant.
Ethically, that is the equivalent of saying "The death-rate due to rabies is 100k per 100k for those patients who have been diagnosed with rabies"

Yep, statistics can be used in rather suspect ways. If you've never read How To Lie With Statistics it's rather enlightening and it should be mandatory reading in school.
ReplyDelete12% for that cohort doesn't seem that high. I mean the youngest is 24 and the oldest is 42. So a 1-in 8 being pregnant is about right. I expect that the pregnancy percentage is clustered in the youngest half though.
ReplyDeleteYep, always apples and oranges to get to the 'agenda' they want and the points they want to make.
ReplyDeleteThat first graph is amazing. Is it published somewhere?
ReplyDelete(Blushing) It is my own work.
DeleteThe population density values are from Wikipedia.
The death rates due to "Suicide/self-harm" are from the CDC Wonder site (https://wonder.cdc.gov/controller/datarequest/D76) for IDC -10 113 cause list U03, X60-X84 and Y87.0
I should start my own TV show "Have Idiot-Savant tendencies, for Hire"
Sorted by "State"