 |
| Image from Nik's Poker Palace |
Not only is it advantageous to not telegraph the quality of the hand you are holding, but it is advantageous to occasionally bluff, or intentionally miscommunicate the quality of your cards. Sometimes you can win with a poor hand. Sometimes you can gull the marks into raising the ante when you have a hand that will crush them.
My friend Nik, over at Nik's Poker Palace informs me that it is more than facial expressions, it is styles of play. He plays a quite a bit of on-line poker and he can discern who he is playing by the consistency of their betting habits and the resulting outcomes.
Unpredictability, qualitatively, has the potential to greatly increase the profitability of one's poker career...provided that it is well timed and is quantitatively appropriate.
In real life

Often times people are paid to manage the behavior of other people. We call them bosses or cops or politicians. One of their primary tools is to impose penalties on the people perpetrating anti-social behaviors.

A typical penalty structure involves a region of "grace" near zero where the cost of administering the penalty exceeds the cost to society. Then there is a step close to the point where the cost to society equals the cost of administering the penalty. Subsequent steps often "progress" in increasingly large steps. The penalties might be monetary or "suspensions" or other actions.
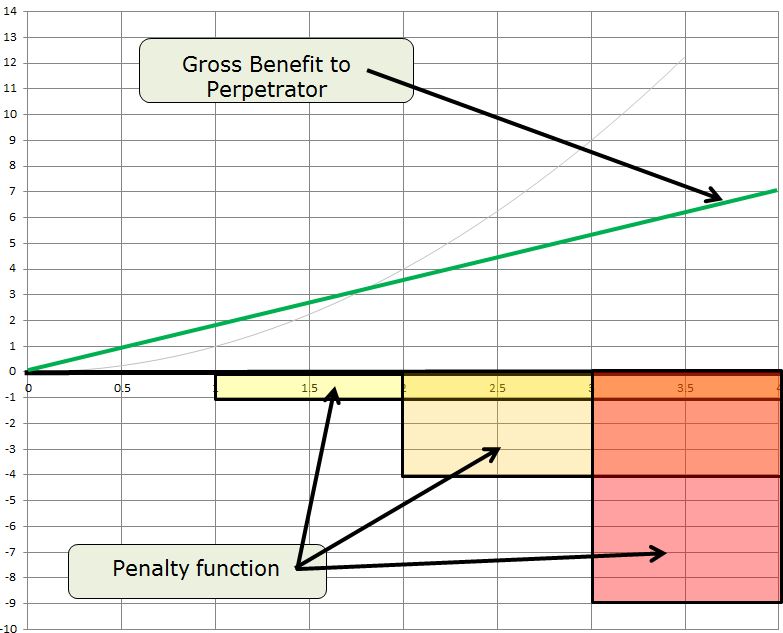 |
| The solid green line shows the gross benefits to the perpetrator for a given anti-social activity. |
 |
| The red circled regions are the levels of behavior that maximize the perpetrator's gain. |
All local maxima will be on the verge of triggering the next step in the penalty function. The net effect from the societal standpoint is that the Taguchi Loss Function degrades from a smooth parabola to a chunky curve.
 |
| The population of anti-social behaviors will not be smoothly distributed. Behaviors will tend to spike to where they are just shy of triggering the next step in the penalty function. |
A solution
 |
| Excuse how busy this slide is. The yellow first step was changed to blue for better visibility. Checkered regions are random, capricious "over-reactions". The solid red line is the new Net Benefit curve that the perpetrator internalizes. The effect of the random over-reaction is to smooth out the steps and eliminate the "hard" local maxima. |
At the risk of hyper-focusing on "small amount": Increased data allows the perpetrator to narrow the confidence bands as their internal map firms up. The narrowing confidence bands act like shrink-wrap and the internalized net benefit curve starts to become "bumpy"...the entire phenomena the boss or cop or politician is attempting to avoid.
This effect extends to transactions other than work-place or school discipline. Consider the negotiator who asks what it would take if he could spend the night with the other party's wife. Even suggesting such an outrageous proposition forces the other party to take nothing for granted and to re-test every assumption.
Trump
I am ambivalent about dragging politics into this discussion, but it is topical and serves to illustrate the concept.

There are some who suggest that President Trump launched 59 cruise missiles to obliterate a Syrian airbase to send notice that the United States is not entirely predictable. There are many parties around the world who feel very safe tweaking Uncle Sam's nose because they "know" the exact length of the rope.
Trump's launch of the cruise missiles replaced the rope with a rubber band and Foghorn needs to recalibrate his antics.
Cautions
It is easy to over-do the capricious and arbitrary portion of the penalty curve. The boss or cop or politician needs to figure out the minimum "signal" that will result in a smoothing of internalized Net Benefit Curve. Or said another way, just enough to keep the other guy on his toes.
Part of his 'theory' also revolves around designing testing. We used some that, especially the validity, reliability, and replicability modes when developing testing in actual environments. Weather became the primary variable, requiring the most dense data collection efforts.
ReplyDelete