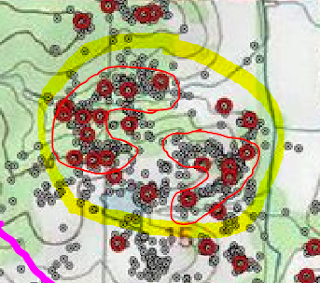
Mississippi State University has a (Whitetail) Deer Ecology and Management Lab. One of their studies was to put GPS trackers on some bucks and study their travel habits and where they "bed".
The map shown above is the signal from one buck, presumably during the month of November when he was in full rut. The red circles are where he bedded down for at least an hour and the white dots are where he pinged-on-the-move.
There are a few things that I think are worth pointing out.
If you ever had cattle you would expected more bedding down in areas like the ones circled in cyan. That is where we see cattle loafing during fly-and-mosquito season, up where there is a breeze and where they have a clear field of vision.
The area circled with the yellow highlighter is approximately 40 acres and it looks like he spends half of his time in that patch.
The "C" shaped area on the left is on a slope and the boomerang on the right is in a flat-floodplain. The high density of pings that form a "line" suggest that he might be working a scrape-line and his beds are close to the line. In fact, if you look closely, you might see a third "line dangling down, southward out of the main area but with fewer beds.
What is encouraging about this is that if you and a neighbor control forty or eighty acres and you both practice the principles of Quality Deer Management there is a pretty good chance that you will harvest the buck you let grow to maturity. After all, he is spending half of his time on forty acres and if you make it a haven for does then that is where he will be likely to center his range.
A hat-tip to Lucas Machias
 v
v
It's a small area that they cover there. Here in the UP on my farm I usually see the same one covering about one and one half up to two sections. Apparently either population density or forest density. Depends where you're at I guess and not the breed. ---ken
ReplyDelete