 |
| The good thing about this chunk of data is that it is relatively flat compared to earlier data |
Still working with the assumption of a six day time-lag between diagnosis and death of the patient. I have yet to see a compelling reason (i.e. data driven reason) to use any other time-lag to analyze data. From April 2 until April 10, inclusive, there were 13,449 patients positively diagnosed with Covid-19.
 |
| Same as "Daily Cases" but six days later |
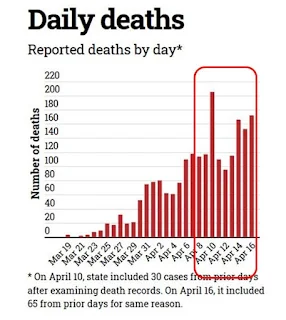
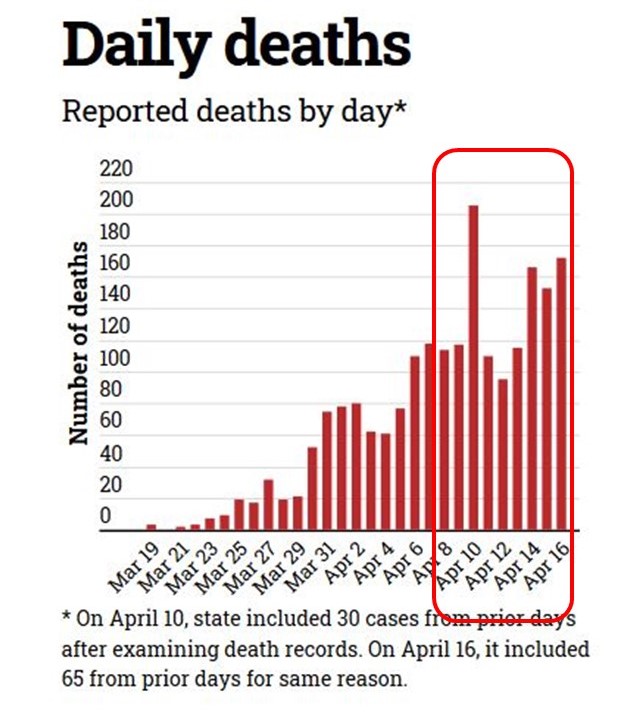
From April 8-to-April 16 (reports publicized at 3:00 EST) there were 1247 deaths attributed to Covid-19 for a death-rate of 9%.
 |
| The ratio between the number of cases and the number of deaths six days later. The data looks bimodal with one population hovering around 6% and the other population bouncing around 12%. Unfortunately, the last three data-points are from the second, presumed population. |
The bump in death-rates is troublesome. Is it due to exhaustion or to more lethal strains of Covid-19 becoming more prevalent?
We have not turned the corner in Michigan, yet.


No comments:
Post a Comment
Readers who are willing to comment make this a better blog. Civil dialog is a valuable thing.